


The United Nations has just published its new world demographic projections for the next few decades. Slightly downward revisions compared to those of 2017.
In 2030, the planet will probably have 8,5 billion inhabitants, and nearly 10 billion in 2050, against 7,9 billion today.
These figures are taken from world population projections that the United Nations has just published. They correspond to the average scenario in which fertility – which is 2,3 children on average per woman today in the world and is decreasing from year to year – continues to fall to reach 2,1 children in 2050 then 1,8, 2100 in XNUMX.
Assuming that fertility declines less quickly, and is eventually 0,5 children higher, the population would reach 10,5 billion in 2050 (high scenario). If it decreases faster, to reach 0,5 children below, the population would only reach 8,9 billion (low scenario).
Figure 1. Evolution of the world population since 1900 and projections until 2100
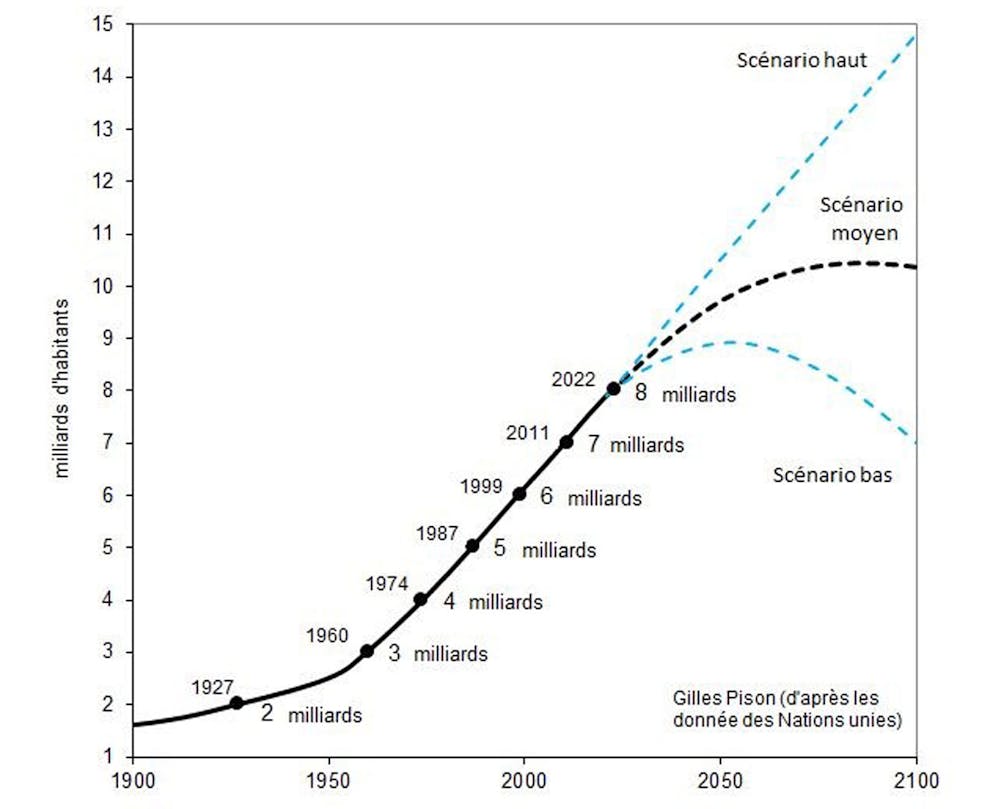
The extension of the projections leads to 10,4 billion inhabitants in 2100 in the medium scenario and respectively 15 and 7 billion in the high and low scenarios, as shown in figure 1 opposite.
Upward revisions for India, downward revisions for China and Africa
These new projections replace those published two years ago. Depending on the country or region, the calculations have been revised upwards or downwards.
In the average scenario, the figure announced for India in 2100 is thus higher by 83 million (6% more) than that announced by the 2019 projections. On the other hand, for China, it is down 294 million (28% less). The same thing for Africa as a whole, which sees its population announced in 2100 reduced by 363 million (8% less).
For the planet as a whole, the upward and downward revisions offset each other, but only partially. The reductions prevail and the world total, still in the medium scenario, is announced in 2050 with 48 million less than in the previous projections (-0,5%) and in 2100 with 520 million less (-5%) .
The United Nations thus revises its population projections every two or three years, and as with the latest, the changes seem modest compared to previous published projections. But accumulated over several decades, they are significant.
Very different projections from 40 years ago
It was in 1981 that the United Nations published the first population projections up to 2100. They then announced 10,5 billion human beings on the planet in 2100 in their average scenario. The latest projections published in July 2022 in predict 0,1 billion less.
Observed over 41 years, the revision is therefore downward, like that operated between 2019 and 2022. But if the total is a little lower, the real change lies in the distribution by continent: Asia, 5,9 billion inhabitants in 2100 according to the projections published in 1981, has only 4,7 by this horizon in those published in 2022 (20% less). The revision is also downward and even more so for Latin America: 647 million in 2100 instead of 1187 (47% less). Conversely, Africa, 2,2 billion inhabitants in 2100 according to the 1981 projections, has almost twice as many, 3,9 billion, in those published in 2022.
Figure 2: Comparison of population projections published in 1981 and in 2022

Mortality has fallen more than expected
The population of a country changes under the effect of fertility and mortality. Migration also plays a role, but to a lesser extent for many countries, and its effect is zero on a global scale. The assumptions about mortality and fertility therefore have the strongest influence on the projections.
Regarding mortality, it has fallen faster than imagined 40 years ago, especially among children, which has led to faster growth. The AIDS epidemic had certainly not been anticipated at the time. Africa, the most affected continent, has paid a heavy price for the disease. But the excess mortality it caused only lasted for a while, life expectancy having started to increase again in recent years, relatively quickly. In the end, the excess mortality due to AIDS will hardly have dented Africa's demographic vitality.
The changes in assumptions that ultimately weighed the most in the revision of projections are those concerning fertility.
Replacement of generations?
Nearly 40 years ago, the United Nations assumed as an average fertility rate of nearly 2,1 children per woman at term in all countries of the world.
In those where it was below this threshold, like most industrialized countries, it should rise gradually to 2,1, then stay there once this level is reached. In countries where fertility was higher, it was supposed to decline to 2,1 children and stay there thereafter.
[Nearly 70 readers trust The Conversation newsletter to better understand the world's major issues. Subscribe today.]
This threshold corresponds to replacement of generations - each couple is replaced on average by two children themselves becoming adults -, and choosing it as the level of convergence amounted to assuming a stabilization in the long term of the world population as well as that of each of the regions composing it. . Hence, in the 1981 projections, the plateau shape that the population curve of each region or country ends up taking once the growth phase is over (figure 2).
In reality, the evolution of fertility was different and the assumptions had to be revised to take into account several surprises.
The surprises of the evolution of fertility
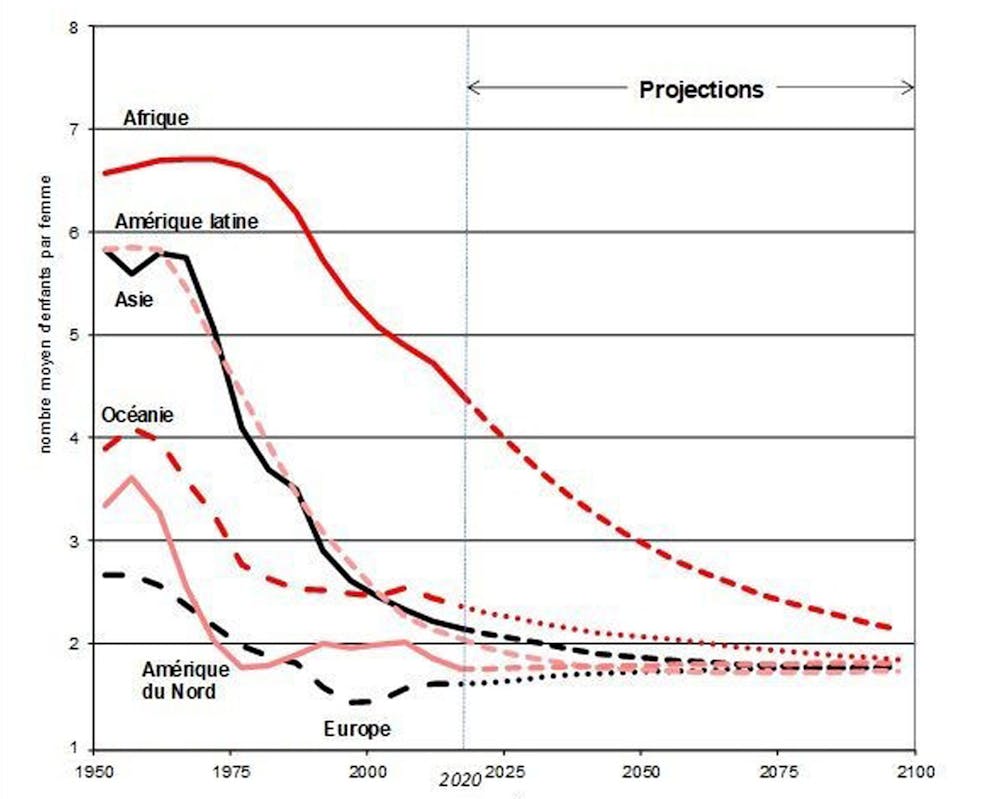
First surprise, fertility has remained well below 2,1 children in many industrialized countries. And many countries of the South have joined the countries of the North in low fertility. The United Nations has therefore abandoned its hypothesis of convergence in the long term at 2,1 children for a convergence below, at 1,85 children, as can be seen in Figure 3 below. The population curves then almost everywhere take on a bell shape: after having reached a maximum, the population begins to decrease (see figure 2 above).
Figure 3: Fertility trends by region of the world from 1950 to 2020 and projections until 2100 (medium scenario)
The second surprise is that 30 to 40 years ago, surveys reveal that fertility began to fall very rapidly, faster than expected, in many countries in Asia and Latin America. As a result, the United Nations has significantly lowered its population projections for these continents.
The third and more recent surprise came from intertropical Africa: it was expected that its fertility would decline later than in Asia and Latin America, because of its lag in socio-economic development. But we imagined a simple time lag, with fertility decreasing at a rate similar to that assumed for the other regions of the South once the decline began.
This is what happened in North Africa and Southern Africa, but not in tropical Africa. In this region, the decline in fertility, although it has started today, is taking place. slower than expected. Hence an increase in projections for Africa which could bring together more than one inhabitant of the planet in three in 2100.
These figures are forecasts and the future is obviously not written. It remains that demographic projections are relatively reliable when it comes to announcing the size of the population in the short term; that is, for a demographer, the next 10, 20 or 30 years. As for more distant projections, they will no doubt experience new revisions according to the surprises that the future holds for us.
Gilles Pison, Anthropologist and demographer, professor at the National Museum of Natural History and associate researcher at INED, National Museum of Natural History (MNHN)
This article is republished from The Conversation under Creative Commons license. Read theoriginal article.